Home > Reseller Manual > Reports > Usage Summary > Task Viewing Bandwidth Usage Graph
Task Viewing Bandwidth Usage Graph
To view bandwidth usage graph:
- Log on to HC9 panel.
- From the left menu click Reports and then Usage Summary.
A drop-down displays.
- Click Bandwidth Usage Report.
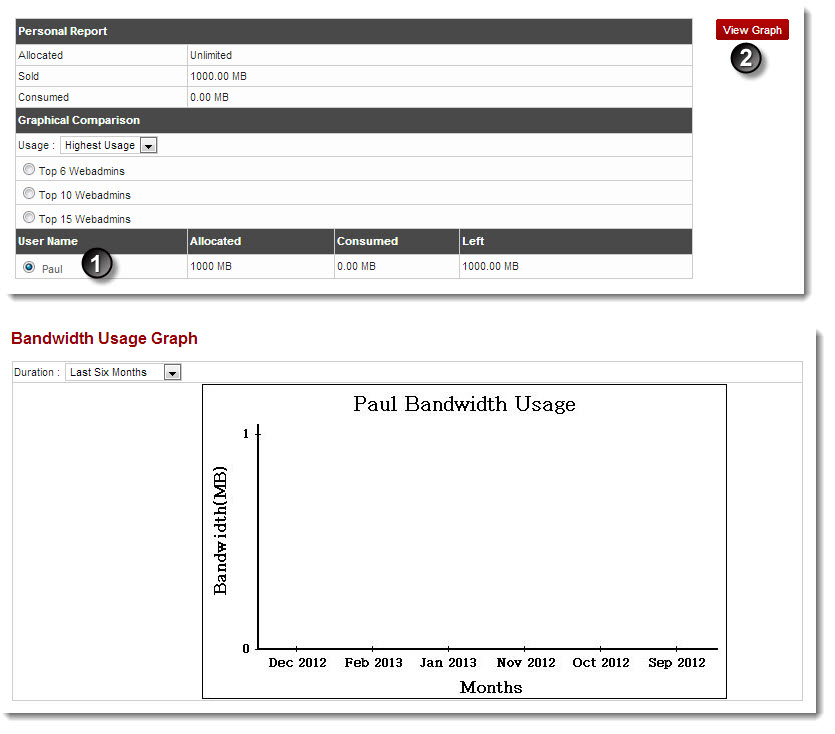
The Bandwidth Usage Report page displays.
- Under User Name column, select user and click View Graph.
The Bandwidth Usage Graph page displays.
- Click the Duration arrow and select time period from the drop-down list box for which you want to see the usage graph.
The Bandwidth Usage Report is displayed.

|
You can also send Bandwidth Usage Report to any of the users listed under User Name column.
To send report via email:
- Click any of the user under User Name column and then click Send Email.
The Email is sent.
|
See also